
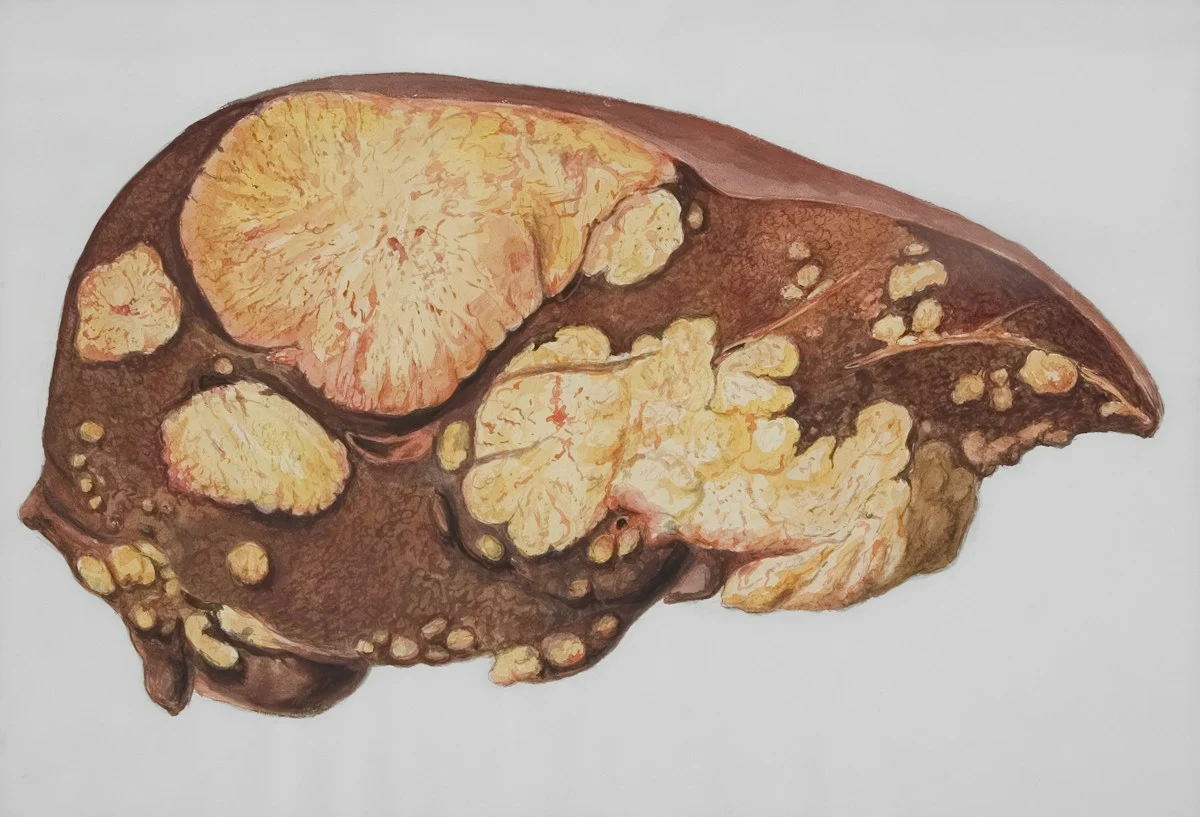
How to Read a FibroScan Report for Fatty Liver
A FibroScan, also called vibration-controlled transient elastography (VCTE), is a non-invasive test commonly used to assess Fatty Liver. A typical report contains two numbers that patients often find confusing: the CAP score and the liver stiffness measurement (LSM).
In simple terms:
- CAP (dB/m) mainly reflects the amount of fat in the liver.
- Liver stiffness (kPa) helps estimate the likelihood of liver fibrosis.
- IQR/median helps assess how consistent the stiffness measurements were.
Importantly, a FibroScan does not by itself give a perfect biopsy-equivalent fibrosis stage. Results should be interpreted together with your history, liver enzymes, platelet count, diabetes/metabolic risk factors and other tests. Different liver diseases, probes and elastography techniques can have different cut-offs.
What Is a FibroScan?
FibroScan uses a brief mechanical vibration and ultrasound-based measurement to estimate liver stiffness. It can also provide a Controlled Attenuation Parameter (CAP), which estimates hepatic steatosis. This makes it particularly useful when evaluating patients with Fatty Liver or metabolic dysfunction-associated steatotic liver disease (MASLD).
For a broader overview, read our guide on Fatty Liver: Causes, Symptoms, Tests, Treatment & Weight Loss.
Step 1: Look at the CAP Score
CAP stands for Controlled Attenuation Parameter and is reported in dB/m. It is an estimate of liver fat, not a measurement of fibrosis.
| CAP value | Common interpretation in MASLD |
|---|---|
| <238 dB/m | Usually below the commonly used threshold for significant steatosis |
| 238–260 dB/m | S1: mild steatosis |
| 260–290 dB/m | S2: moderate steatosis |
| >290 dB/m | S3: severe steatosis |
These ranges are useful as a guide, but CAP cut-offs are not universal. They can vary according to the device, probe, population and clinical setting. Therefore, your report should not be interpreted from the CAP number alone.
Example
If your report says CAP 315 dB/m, this suggests a substantial amount of liver fat. It does not mean that you have severe fibrosis or cirrhosis.
Step 2: Look at Liver Stiffness in kPa
The second major number is the liver stiffness measurement (LSM), usually reported in kilopascals (kPa).
Higher liver stiffness can be associated with more advanced fibrosis. However, liver stiffness can also rise temporarily because of factors such as active inflammation, cholestasis, hepatic congestion and recent food intake. Therefore, a high kPa value should be interpreted in context.
For patients with MASLD, an AASLD educational risk-stratification approach commonly uses:
| LSM by VCTE | General risk interpretation |
|---|---|
| <8 kPa | Low risk of advanced fibrosis |
| 8–12 kPa | Intermediate risk; clinical context and additional testing may be needed |
| >12 kPa | Higher risk; further specialist assessment is generally appropriate |
These are risk bands, not exact fibrosis stages. You should not automatically convert 8, 10 or 12 kPa into a precise F2, F3 or F4 stage. Cut-offs differ by disease cause, probe, technique and clinical context.
CAP and kPa Are Measuring Different Things
This is one of the most important points when reading a FibroScan report.
| Report item | Unit | Main purpose |
|---|---|---|
| CAP | dB/m | Estimates liver fat |
| LSM / Liver stiffness | kPa | Estimates fibrosis risk |
| IQR/median | % or ratio | Assesses consistency/reliability of stiffness measurements |
For example, a person may have a high CAP but low liver stiffness. That can indicate substantial Fatty Liver without evidence of advanced fibrosis on that test. Conversely, a high liver stiffness value deserves attention even if the CAP is not very high.
Step 3: Check the IQR/Median
The FibroScan obtains multiple measurements rather than relying on a single reading. The IQR/median ratio describes how variable those measurements were.
As a commonly used quality measure for stiffness values reported in kPa, an IQR/median of 30% or less is generally considered acceptable. Lower values indicate greater consistency. An IQR/median above 30% may reduce confidence in the result, particularly when the median stiffness is elevated.
Also look for the number of valid measurements and the report’s quality/reliability statement. A technically difficult examination may need to be repeated or interpreted cautiously.
Step 4: Check Whether the Test Was Performed Properly
Several factors can affect liver stiffness. Depending on the clinical situation, your doctor may consider:
- Whether you were adequately fasting before the examination
- Recent food intake
- Markedly elevated liver enzymes or active inflammation
- Bile duct obstruction/cholestasis
- Heart failure or hepatic venous congestion
- Alcohol-related liver disease
- Body habitus and whether the appropriate probe was used
- Ascites or technical difficulties during measurement
For this reason, a FibroScan number should never be interpreted in isolation.
Step 5: Combine FibroScan With FIB-4 and Blood Tests
FibroScan is often more useful when combined with a blood-based fibrosis assessment such as FIB-4. FIB-4 uses age, AST, ALT and platelet count to estimate the likelihood of advanced fibrosis.
In many adults with suspected MASLD, a FIB-4 below 1.3 is used as a low-risk threshold, while a value of 1.3 or higher generally prompts a secondary assessment such as VCTE/FibroScan or another non-invasive test. Values above 2.67 suggest a higher likelihood of advanced fibrosis, although additional assessment is still often appropriate.
FIB-4 has important limitations, particularly at younger and older ages, so your doctor may use different thresholds or additional tests.
What Does a FibroScan Report With Fatty Liver Look Like?
Consider a hypothetical report:
- CAP: 305 dB/m
- LSM: 7.2 kPa
- IQR/median: 12%
- Valid measurements: 10
This pattern would suggest a substantial amount of liver fat, while the stiffness result would fall below the commonly used 8 kPa threshold for low risk of advanced fibrosis in MASLD. The low IQR/median would also indicate good consistency of the stiffness measurements.
However, this does not mean that every person with these numbers has exactly the same degree of fibrosis. Clinical context still matters.
Can a FibroScan Diagnose Cirrhosis?
FibroScan can provide important evidence about the likelihood of advanced fibrosis or cirrhosis, but there is no single kPa value that proves cirrhosis in every patient.
If stiffness is substantially elevated, your doctor may combine FibroScan with platelet count, liver function tests, ultrasound or other imaging, FIB-4 and sometimes MR elastography or specialist evaluation.
When Should You See an Endocrinologist or Liver Specialist?
Medical assessment is especially important if you have:
- Persistently elevated liver enzymes
- Type 2 Diabetes or prediabetes
- Excess body weight or metabolic syndrome
- High triglycerides or other metabolic risk factors
- A high or indeterminate FIB-4 score
- FibroScan stiffness in an intermediate or high-risk range
- Features suggesting advanced chronic liver disease
Patients with Fatty Liver often benefit from coordinated management of glucose, blood pressure, lipids, weight and liver risk. If you are looking for a Diabetes Doctor in Ahmedabad, diabetes and metabolic risk factors can be assessed as part of the overall picture.
Can FibroScan Results Improve?
Liver stiffness can change over time, but a fall in kPa does not automatically prove that fibrosis has completely reversed. Stiffness is influenced by more than scar tissue, including inflammation and other physiological factors.
For follow-up, it is useful to compare results obtained using a similar technique and to interpret the change alongside weight, metabolic control, liver enzymes and other fibrosis assessments.
Key Takeaways: How to Read a FibroScan
- CAP tells you about liver fat; kPa tells you about liver stiffness.
- A high CAP does not automatically mean advanced fibrosis.
- Higher kPa generally means greater concern for fibrosis, but cut-offs vary.
- For MASLD, <8 kPa is commonly used as a low-risk range for advanced fibrosis; 8–12 kPa is intermediate and >12 kPa is higher risk in commonly used AASLD educational guidance.
- Check the IQR/median and number of valid measurements before trusting a stiffness result.
- FIB-4 and other blood tests can complement FibroScan.
- Do not diagnose cirrhosis from a single FibroScan number.
- Discuss the complete report with an endocrinologist, gastroenterologist or hepatologist when risk is elevated or the result is unclear.
References
- AASLD: Noninvasive Assessment of Patients With MASLD
- AASLD: Steatotic Liver Disease and Non-invasive Fibrosis Assessment
- EASL: Clinical Practice Guidance on Non-invasive Tests
- Boursier et al.: Reliability criteria for liver stiffness measurement by transient elastography
Consult Dr. Moxit Shah, DM Endocrinology in Ahmedabad
If you have Fatty Liver along with Diabetes, insulin resistance, excess body weight, high triglycerides or other metabolic problems, an endocrinology assessment can help address the underlying metabolic risk factors.
Vishuddha Endocrine Clinic
104-105, Elite Magnum, Bhuyangdev Cross Road, Opp. Utsav Elegance, Vardhmannagar Society, Ghatlodiya/Memnagar, Ahmedabad, Gujarat 380061
Phone: +91 99799 92797
Dr. Moxit Shah, DM Endocrinology provides evaluation and management of Diabetes, Thyroid, Weight Loss and endocrine/metabolic disorders.